Recommended Posts
3 Powerful Techniques to Determine Forex Trend Strength in 2024
0 comments
Every trader wants to know how to identify trends and determine their relative strength.
It’s what allows us to trade with momentum rather than against it, which in turn increases the odds of a favorable outcome.
Unfortunately, gauging the strength of a trend isn’t as straightforward a task as some would hope.
Let me rephrase that, the plethora of indicators and techniques that have flooded the financial world over the years have unnecessarily convoluted a relatively simple task.
But I digress…
Yes, it is a simple task. Is it easy? Well, that depends on the techniques and tools you decide to use.
There are three very simple techniques that I will show you today that, with enough practice, will make determining trend strength a much more manageable task.
By the time you finish reading this lesson, you will have a firm understanding of trend characteristics as well as when to know whether to look for a continuation of the current trend or an imminent breakdown.
Let’s get started!
What is a Trending Market?
First and foremost, we need to know how to identify a trending market. Traders have complicated the topic for years, but it’s very simple, I promise.
A trending market is one that is making higher highs followed by higher lows or lower lows followed by lower highs.
That’s it.
If we transform that statement into its visual equivalent, we get the following illustration.
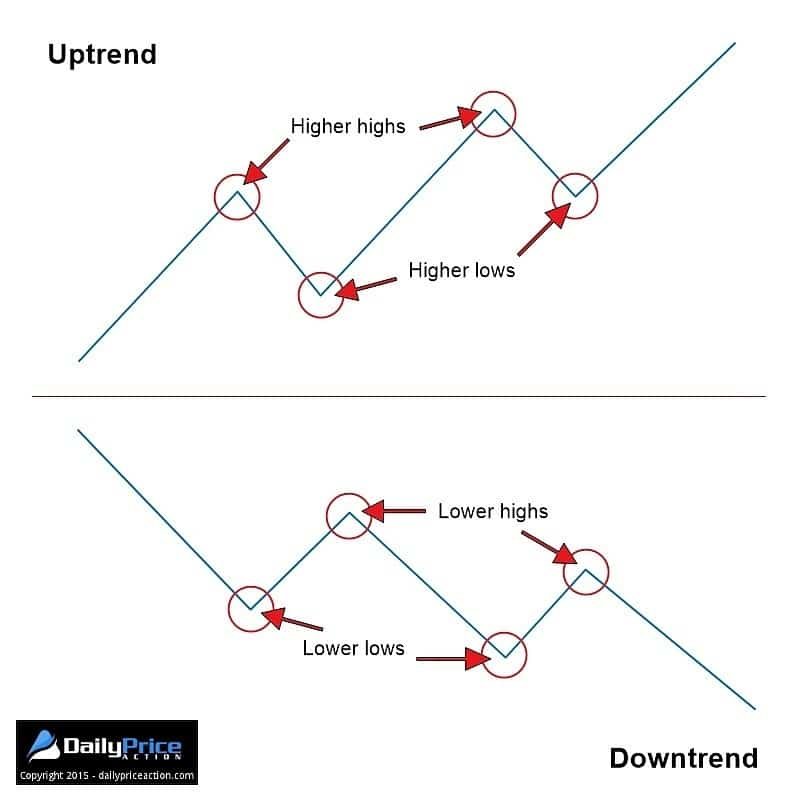
Pretty basic stuff, right?
I thought so!
But before you leave thinking you know about the concept of higher highs, higher lows, etc., there are some concepts later in the lesson that may not be familiar to you. In fact, I would bet that 90% of Forex traders don’t know to look for what I’m about to show you.
In other words, you may want to stick around.
Now comes the fun part – taking this very basic concept of highs and lows and turning it into actionable information.
For that, we turn to the most basic principle of technical analysis.
1: A Market’s Highs and Lows Tell the Story
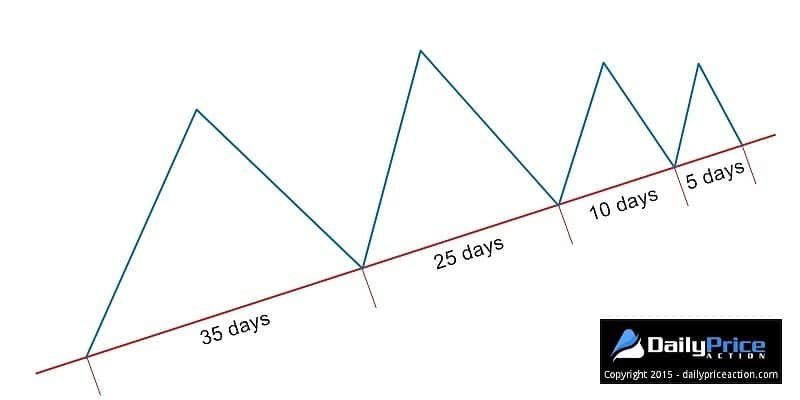
Let’s start things off by just visualizing where the highs and lows on a chart have formed over a period. In short, the relationship among highs and lows as they form over time.
All we are doing with this technique is observing where the extended swing highs and lows are within a given trend.
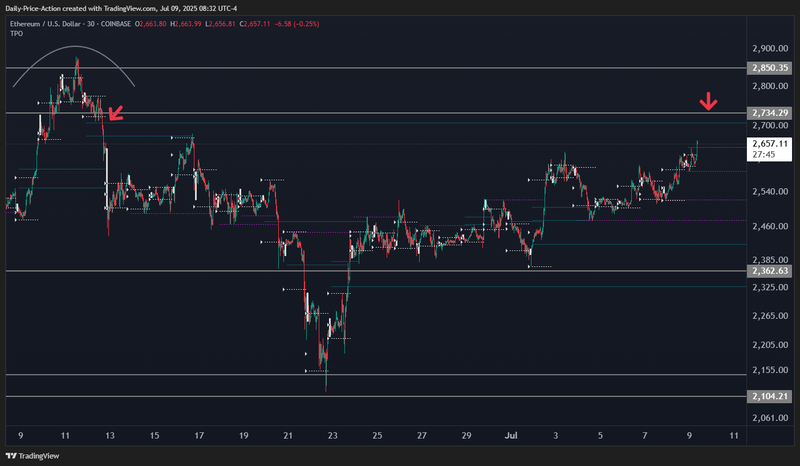
The GBPUSD daily chart below is a perfect example of how something as simple as watching how the highs and lows of a market interact with each other can signal a change in trend.
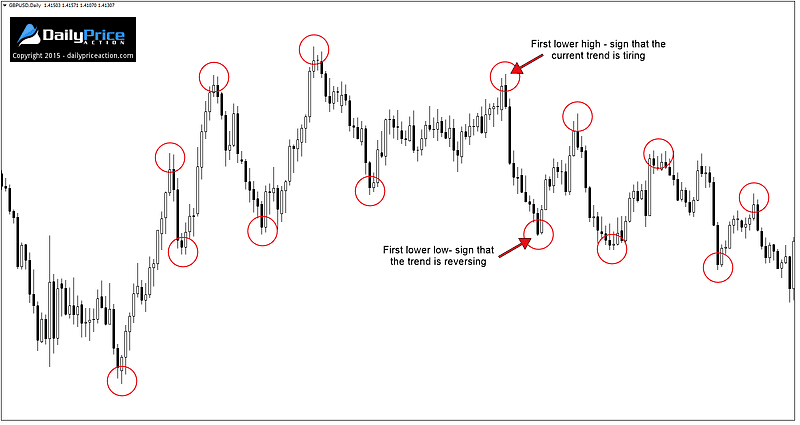
Notice how over the course of several months, GBPUSD carved out somewhat of a rounding top, which is a valid technical pattern. However, for purposes of this lesson, we’re only interested in using the swing highs and lows to identify a possible change in trend.
In the chart above, the first lower high was the first sign that the uptrend was beginning to fatigue. But it wasn’t until the first lower low that we had a telling indication that the current trend had reversed.
Keep in mind that trend changes won’t always be this obvious. But the signs are always there; you may just have to look a bit harder to find them in some instances.
At this point you may be thinking, this is great and all, but how/where do we enter short?
For that, we need the highs and lows to interact with a key level in a way that offers a favorable setup. In other words, we need to turn the price action you see in the chart above into actionable information.
Comments